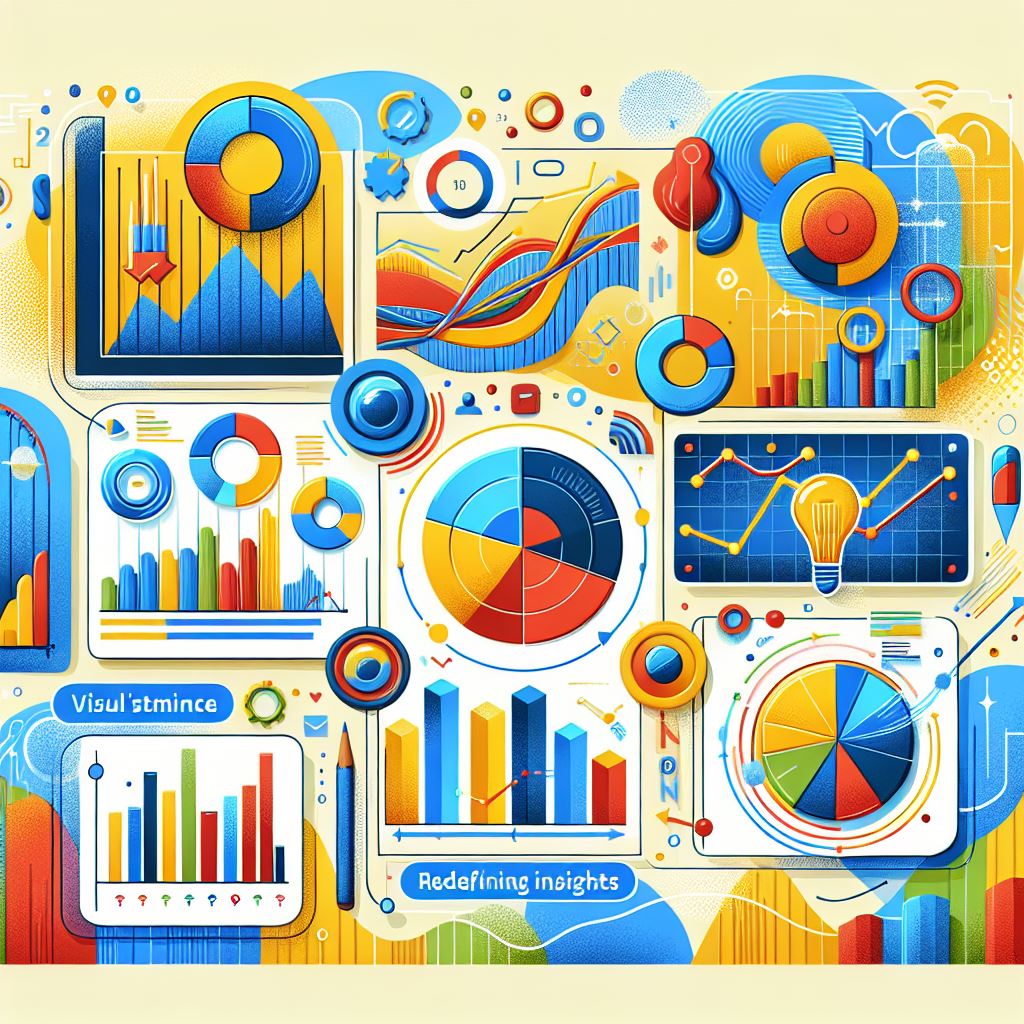
The world of data analytics is evolving. Traditional static reports, once the gold standard for business reporting, are now being replaced by dynamic dashboards. These innovative tools are redefining how businesses visualise and interact with data, offering real-time insights and a deeper understanding of trends. As the demand for faster, more flexible data solutions grows, dynamic dashboards are becoming indispensable for businesses striving to remain competitive.
Why Static Reports Are Becoming Obsolete
Static reports have long served as a cornerstone of business decision-making. These fixed documents provide a snapshot of metrics over a defined period, such as monthly sales or quarterly performance. However, their limitations are becoming increasingly apparent.
Static reports:
- Lack interactivity: Users cannot explore data beyond what’s presented.
- Are time-consuming to produce: Analysts often spend hours compiling and formatting data.
- Risk becoming outdated: By the time they are circulated, the data may no longer reflect current trends.
In an era of real-time information and agile decision-making, these drawbacks highlight the need for more dynamic tools.
Introducing Dynamic Dashboards
Dynamic dashboards are interactive tools that pull data from live sources to provide up-to-date insights. Unlike static reports, they allow users to interact with data in real time—filtering, drilling down, and customising views as needed.
These dashboards are not just visually appealing; they are functional and versatile, making them an essential component of modern business intelligence.
The Benefits of Dynamic Dashboards
Dynamic dashboards offer several advantages over their static counterparts:
1. Real-Time Insights
Dynamic dashboards provide immediate access to the latest data, enabling organisations to react quickly to changing circumstances. For example, retailers can monitor sales performance during a promotional campaign and adjust strategies on the fly.
2. Enhanced Interactivity
The ability to explore data interactively helps users uncover deeper insights. Filters, drill-down options, and customisable views make it easier to identify trends and patterns that static reports might miss.
3. Time Efficiency
Automating data updates eliminates the need for manual report generation. This saves time for analysts and ensures decision-makers always have access to fresh insights.
4. Improved Accuracy
Dynamic dashboards pull data directly from integrated systems, reducing the risk of human error. This ensures the reliability of information, which is crucial for decision-making.
5. Cross-Department Collaboration
Dashboards provide a shared platform for accessing data. Teams across different departments can work from the same dataset, fostering alignment and improving communication.
Leading Tools for Dynamic Dashboards
Several platforms are at the forefront of the dynamic dashboard revolution. These tools offer user-friendly interfaces and powerful features for businesses of all sizes.
Tableau
Tableau is a leader in data visualisation. Its drag-and-drop interface makes it easy to create interactive dashboards that connect to multiple data sources. Tableau is especially popular for its ability to handle complex datasets and present them in visually compelling formats.
Power BI
Microsoft’s Power BI is widely used for its seamless integration with other Microsoft products like Excel and Azure. It offers robust capabilities for creating dynamic dashboards and is suitable for organisations ranging from small businesses to large enterprises.
Looker Studio
Previously known as Google Data Studio, Looker Studio is a free, cloud-based tool that integrates with Google’s suite of products. Its intuitive interface makes it an excellent choice for teams that rely heavily on Google Analytics, Sheets, or BigQuery.
How Dynamic Dashboards Are Used Across Industries
Dynamic dashboards are versatile tools with applications in virtually every industry. Here are a few examples:
Retail
Retailers use dashboards to monitor sales trends, inventory levels, and customer behaviour. Real-time insights help them optimise pricing, improve supply chain efficiency, and personalise marketing campaigns.
Healthcare
In healthcare, dashboards enable providers to track patient outcomes, manage resource allocation, and monitor performance metrics. Real-time updates are critical for responding to emergencies and improving patient care.
Finance
Financial institutions rely on dashboards to analyse market trends, monitor portfolio performance, and assess risks. The ability to visualise data dynamically helps financial professionals make informed investment decisions.
Marketing
Marketers use dashboards to track campaign performance, monitor website traffic, and analyse customer engagement. Real-time data allows for immediate adjustments to improve results.
Dynamic Dashboards: Transforming Decision-Making
The shift from static reports to dynamic dashboards is more than just a technological upgrade—it’s a paradigm shift in how organisations approach data. By providing real-time, interactive insights, dynamic dashboards empower decision-makers to act with confidence and agility.
Whether it’s tracking sales, optimising operations, or analysing customer behaviour, the benefits of dynamic dashboards are clear. As businesses continue to prioritise data-driven strategies, these tools will play an increasingly central role in shaping success.
Conclusion
Dynamic dashboards are revolutionising the way businesses visualise and utilise data. By replacing static reports with real-time, interactive tools, organisations can unlock deeper insights, improve collaboration, and make smarter decisions faster. With platforms like Tableau, Power BI, and Looker Studio leading the charge, the future of data visualisation is bright—and dynamic.


